Request logs
Learn how to set up Sanity to deliver detailed logs for API requests, enabling insights into content interaction and bandwidth usage.
Sanity can be set up to deliver detailed logs for all API requests related to a project. This allows you to make informed decisions about how content is requested and interacted with in the Content Lake.
You can use these logs to get insights into what’s driving requests and bandwidth usage, where requests come from, and more.
Enrich your logs with request tags
Sanity’s Content Lake supports marking your requests with tags as a simple but powerful way of adding some context to your API activities. Visit the request tags reference article to learn more about this feature.
Request logs for self-serve plans
You can access request logs on self-serve plans by going to the Usage section of your project settings. At the bottom of this page, you'll find a button to download up to 1GB of log data from the last 7 days up to the day before you download the data. You can request a new export every 24 hours.
Analyzing request logs
The request log export will come as a compressed NDJSON file. You use different tools to analyze this like GROQ CLI or jq. You can even convert it to CSV using a package like json2csv:
gunzip --stdout [compressed logfile].ndjson.gz | npx json2csv --ndjson --output [output].csv
Exploring tools like Jupyter Notebook can also be helpful for more extensive analysis.
Another helpful tip is to upload a sample of your log files to AI tools like ChatGPT and ask them to analyze it or provide you with methods for doing so in Python or other programming languages and frameworks.
Visit the request log data reference to learn how the logs are structured and formatted.
Request logs on enterprise plans
For projects on enterprise plans, logs are delivered as compressed NDJSON files to your Google Cloud Storage (GCS) bucket, which then serves as a staging area for ingesting the reports into a data analysis tool of your choice.
This is a paid feature
This feature is available on certain Enterprise plans. Talk to sales to learn more.
Visit the request log data reference to learn how the logs are structured and formatted.
Enable and configure log delivery
You can always extract, that is, download, the raw request log file on demand for ad hoc analysis. However, you can save time and make insights more broadly accessible to your team if you load logs into a data lake, such as BigQuery, and set up pre-defined queries for common reports.
The entire process – from enabling the log delivery service to querying your data for insights – requires a few separate steps to set up and follows the Extract, Load, and Transform (ELT) pattern for data integration. You will find an example implementation below, detailing how to implement Sanity request logs with Google Cloud Storage and BigQuery.
Step 1: Extract (required)
In this step, you will enable log delivery in your Sanity project and connect your GCS bucket in the Sanity project management settings. The setup described in this step is the only part of this guide that is required to use the request log feature, while the subsequent steps are provided as an example implementation.
Prerequisites
- A Sanity account with administrator access to project management settings
- A GCS account with permission to create and administrate GCS buckets
- Optionally: Access to and familiarity with command line tooling like
node,npm, and the gcloud suite of tools. While this guide demonstrates how to achieve the necessary setup in GCP using the command line, the same result can be achieved using the GCP web interface.
Configure project in gcloud CLI
Ensure that the Google Cloud CLI is configured to the correct project for where you want to store your request logs.
# Replace [PROJECT_ID] with your actual Google Cloud project ID

gcloud config set project [PROJECT_ID]
Create the bucket
Create a new GCS bucket where your files will be uploaded to.
# Replace [BUCKET_NAME] with your actual bucket name

gcloud storage buckets create gs://[BUCKET_NAME]
Give Sanity access to the bucket
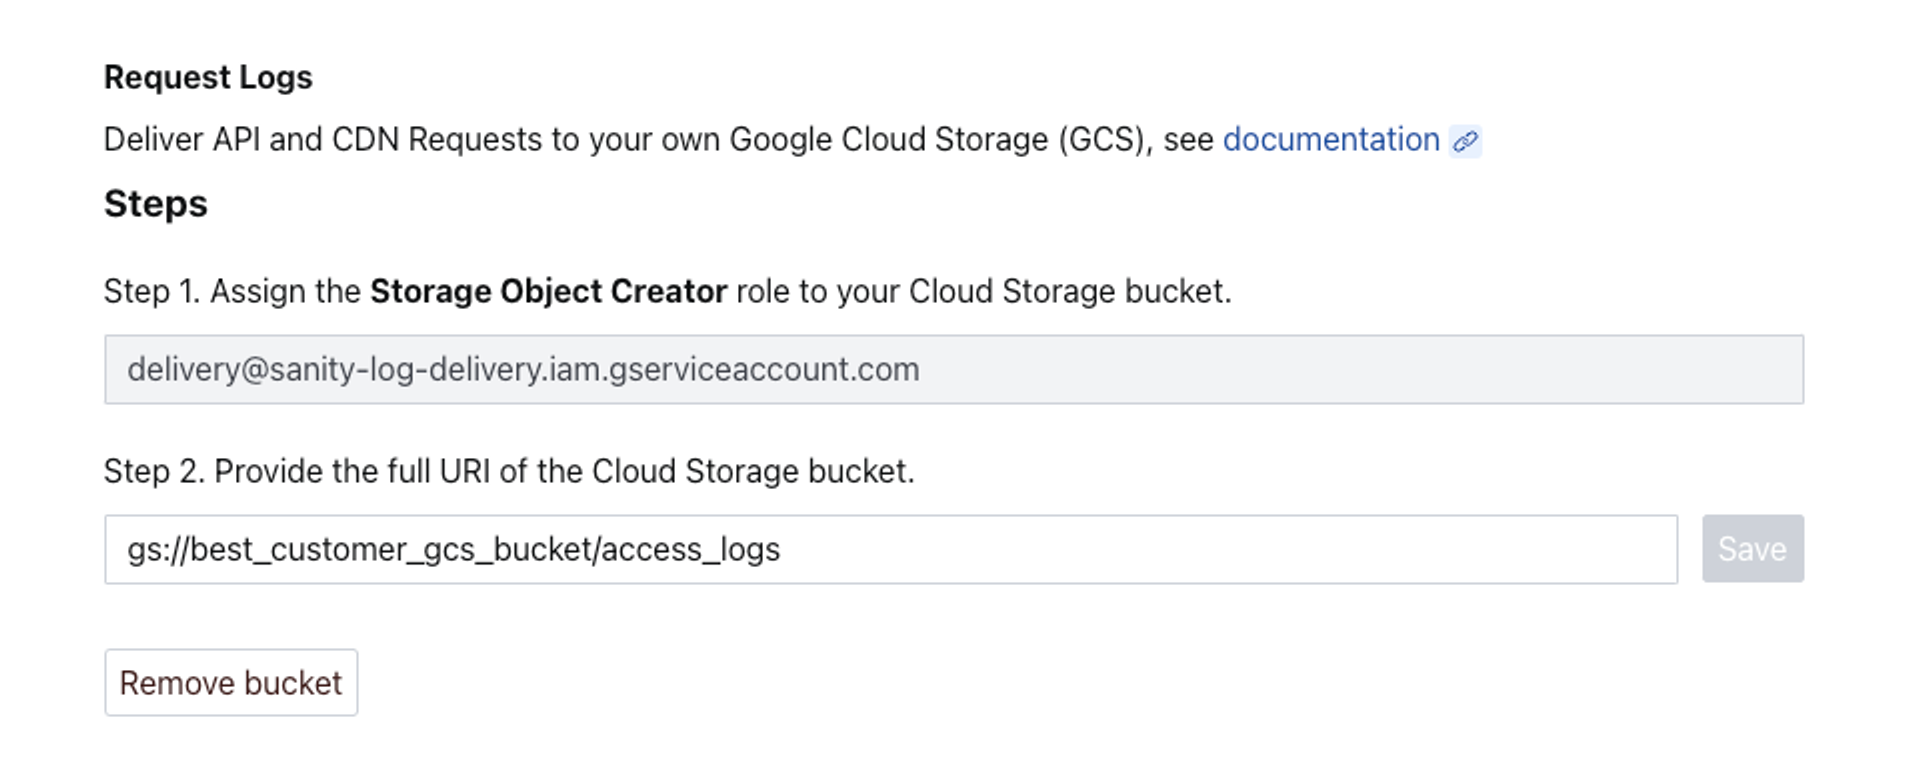
For Sanity to deliver files to your GCS bucket, you must give our service account (serviceAccount:delivery@sanity-log-delivery.iam.gserviceaccount.com) the storage.objectCreator role:
# Replace [BUCKET_NAME] with your actual bucket name

gcloud storage buckets add-iam-policy-binding gs://[BUCKET_NAME] --member=serviceAccount:delivery@sanity-log-delivery.iam.gserviceaccount.com --role=roles/storage.objectCreator
Enable log delivery on your Sanity project
Log Delivery is disabled by default. It must be enabled in the Sanity project settings by a project administrator.
- Log in to Manage: www.sanity.io/manage
- Navigate to your project settings. You should see an option to enable the log delivery feature by adding a GCS bucket.
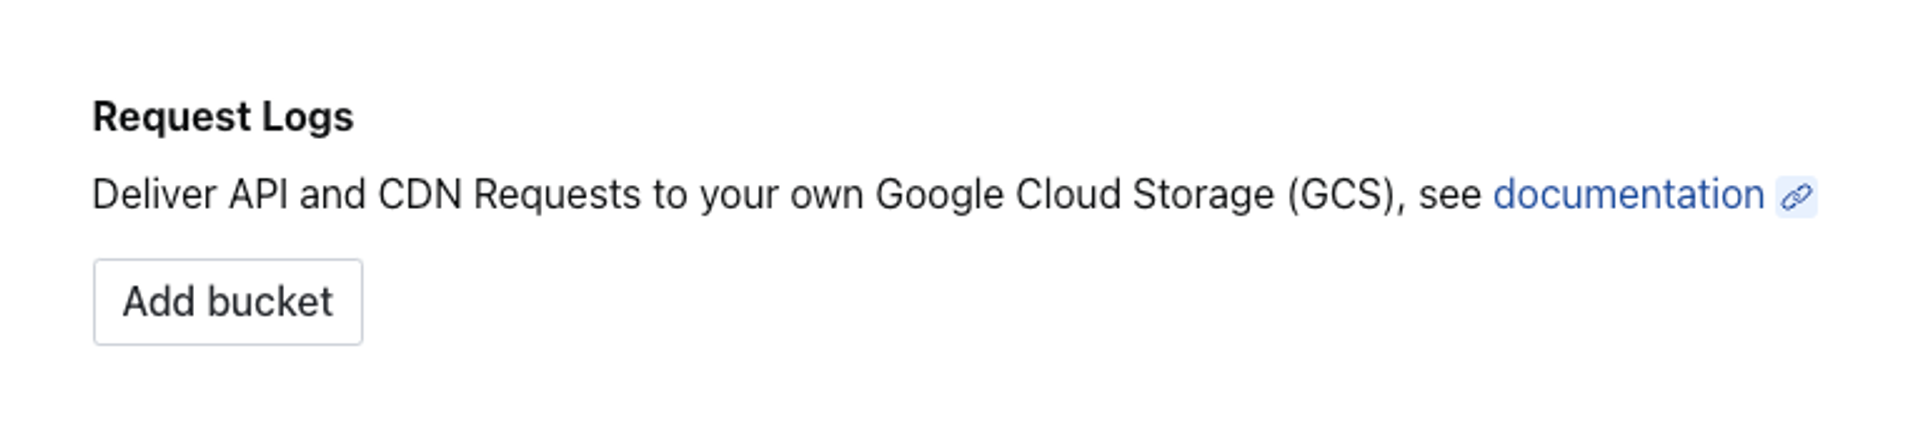
- Click the button labeled Add bucket and you should be prompted to add the full URI of your GCS bucket.
- Assuming everything went well, you should now be set to receive API request logs within a couple of minutes. You may read on to see an example implementation or roll your own with the tooling of your choice.
Step 2: Load (optional)
Once the pipeline for log delivery has been configured, it’s time to hook up your preferred data analysis tool. The process will vary somewhat from tool to tool. The following section will show you how to accomplish this task using BigQuery from Google.
You can set up a direct connection between BigQuery and GCS buckets using External Tables. Please read the documentation to understand the costs and limitations.
Sanity has structured the bucket key in a way that allows for partitioning per project, event type, and date.
We key the object using Hive partitioning with the following format:
gs://event-logs/project_id=[string]/kind=[event-type:string]/dt=[date:DATE]/[file-name:string].ndjson.gzThis allows the log data to be loaded into various data platforms with the project ID, data type, and date used as partitioning properties.
Prerequisites
- You should have completed the setup process described in step 1, so you are starting with the log delivery service already enabled and connected to your GCS bucket
- You’ll need
node,npm, and thegcloudcommand line tools installed
Define your table schema
Create a JSON file locally named schema.json with the nested schema definition for your log data.
Protip
If you’re working on a Sanity Studio project, we recommend placing this schema file in its folder (for example, /log-delivery/schema.json) to avoid confusion with the Studio schema for your content model.
{
  "sourceFormat": "NEWLINE_DELIMITED_JSON",
  "schema": {
    "fields": [
      { "name": "timestamp", "type": "TIMESTAMP", "mode": "REQUIRED" },
      { "name": "traceId", "type": "STRING", "mode": "REQUIRED" },
      { "name": "spanId", "type": "STRING", "mode": "REQUIRED" },
      { "name": "severityText", "type": "STRING", "mode": "NULLABLE" },
      { "name": "severityNumber", "type": "INT64", "mode": "REQUIRED" },
      {
        "name": "body",
        "type": "RECORD",
        "mode": "REQUIRED",
        "fields": [
          { "name": "duration", "type": "DECIMAL", "mode": "NULLABLE" },
          { "name": "insertId", "type": "STRING", "mode": "NULLABLE" },
          { "name": "method", "type": "STRING", "mode": "NULLABLE" },
          { "name": "referer", "type": "STRING", "mode": "NULLABLE" },
          { "name": "remoteIp", "type": "STRING", "mode": "NULLABLE" },
          { "name": "requestSize", "type": "INT64", "mode": "NULLABLE" },
          { "name": "responseSize", "type": "INT64", "mode": "NULLABLE" },
          { "name": "status", "type": "INT64", "mode": "NULLABLE" },
          { "name": "url", "type": "STRING", "mode": "NULLABLE" },
          { "name": "userAgent", "type": "STRING", "mode": "NULLABLE" }
        ]
      },
      {
        "name": "attributes",
        "type": "RECORD",
        "mode": "NULLABLE",
        "fields": [
          {
            "name": "sanity",
            "type": "RECORD",
            "mode": "NULLABLE",
            "fields": [
              { "name": "projectId", "type": "STRING", "mode": "REQUIRED" },
              { "name": "dataset", "type": "STRING", "mode": "NULLABLE" },
              { "name": "domain", "type": "STRING", "mode": "NULLABLE" },
              {
                "name": "groqQueryIdentifier",
                "type": "STRING",
                "mode": "NULLABLE"
              },
              { "name": "apiVersion", "type": "STRING", "mode": "NULLABLE" },
              { "name": "endpoint", "type": "STRING", "mode": "NULLABLE" },
              { "name": "tags", "type": "STRING", "mode": "REPEATED" },
              { "name": "studioRequest", "type": "BOOLEAN", "mode": "NULLABLE" }
            ]
          }
        ]
      },
      {
        "name": "resource",
        "type": "RECORD",
        "mode": "REQUIRED",
        "fields": [
          {
            "name": "service",
            "type": "RECORD",
            "mode": "NULLABLE",
            "fields": [{ "name": "name", "type": "STRING", "mode": "NULLABLE" }]
          },
          {
            "name": "sanity",
            "type": "RECORD",
            "mode": "NULLABLE",
            "fields": [
              { "name": "type", "type": "STRING", "mode": "NULLABLE" },
              { "name": "version", "type": "STRING", "mode": "NULLABLE" }
            ]
          }
        ]
      }
    ]
  },
  "compression": "GZIP",
  "sourceUris": ["gs://[BUCKET_NAME]/[PREFIX]event-logs/*"],
  "hivePartitioningOptions": {
    "mode": "CUSTOM",
    "sourceUriPrefix": "gs://[BUCKET_NAME]/[PREFIX]event-logs/{project_id:STRING}/{kind:STRING}/{dt:DATE}/"
  }
}
Gotcha
Make sure to replace [BUCKET_NAME] and [PREFIX] with the appropriate values for your setup.
Creating the external table in BigQuery
Run the following command using the bq (BigQuery) CLI tool bundled with the gcloud CLI:
# Replace [DATASET_NAME] and [TABLE_NAME] with your details

bq mk --external_table_definition=schema.json [DATASET_NAME].[TABLE_NAME]
Query your log data in BigQuery
Once the log data is loaded into the table, you can run queries against it to test if the implementation works as expected.
Example: Get data from yesterday.
/* Replace [GCP_PROJECT_NAME], [DATASET_NAME], and [TABLE_NAME] with your details */

SELECT
  *
FROM
  `[GCP_PROJECT_NAME].[DATASET_NAME].[TABLE_NAME]`
WHERE
  project_id = '[SANITY_PROJECT_ID]' AND
  kind = 'request-log' AND
  dt = DATE_ADD(CURRENT_DATE(), INTERVAL -1 DAY)
Step 3: Transform (optional)
Your log data is now ready to provide answers and insights into API and CDN usage. The following section will show how to query your logs using BigQuery and SQL.
Protip
You can also use AI solutions like ChatGPT to figure out queries for specific questions by giving it the log table schema and specifying that you are working with BigQuery.
Prerequisites
At this point, you should have accomplished the following:
- Enabling log delivery in the Sanity project management console
- Connecting your Google Cloud Storage (GCS) bucket, and verifying that logs are being delivered as expected
- Loading your log data into GCS BigQuery, so it’s ready for querying
You will also need the appropriate user privileges to query BigQuery in the Google Cloud Platform.
Gotcha
Caution: BigQuery can get expensive when querying large datasets as they have a pay-per-usage model by default. Before running queries on this platform, understand the BigQuery pricing model and how your query will impact cost.
Example 1: Which asset is downloaded the most?
Sanity projects are metered on bandwidth usage. A large part of bandwidth usage can come from image and video downloads. Use this BigQuery query to understand which asset is using the most bandwidth.
/* Replace [PROJECT], [DATASET], and [TABLE_NAME] with your details */

SELECT body.url, sum(body.responseSize) / 1000 / 1000 AS responseMBs
FROM `[PROJECT].[DATASET].[TABLE_NAME]`
WHERE  attributes.sanity.domain = 'cdn'
  AND timestamp > TIMESTAMP_ADD(CURRENT_TIMESTAMP(), INTERVAL -1 DAY)
GROUP BY 1
ORDER BY 2 DESC
LIMIT 10;
You can use this information to search your Sanity dataset for the documents using this asset and then optimize to reduce bandwidth.
Example 2: What is the average response time for a GROQ query?
/* Replace [PROJECT], [DATASET], and [TABLE_NAME] with your details */

SELECT
  DATE(timestamp) AS date,
  body.method,
  attributes.sanity.groqQueryIdentifier AS groq_query_identifier,
  COUNT(*) as times_called,
  AVG(body.duration) / 1000 AS average_response_time_seconds
FROM
  `[PROJECT].[DATASET].[TABLE_NAME]`
WHERE
  body.duration IS NOT NULL
  AND attributes.sanity.groqQueryIdentifier IS NOT NULL
  AND attributes.sanity.groqQueryIdentifier != ""
  AND body.method = "GET"
  AND attributes.sanity.endpoint = "query"
GROUP BY
  1,2,3
ORDER BY
  1 DESC,5 DESC,4 DESC
Note we cannot create a GROQ query identifier if the query is in a POST body.
Example 3: How many requests return user or server errors?
/* Replace [PROJECT], [DATASET], and [TABLE_NAME] with your details */

WITH ErrorCount AS (
  SELECT
    DATE(timestamp) AS date,
    COUNTIF(body.status >= 500) AS server_error_count,
    COUNTIF(body.status >= 400 AND body.status < 500) AS user_error_count,
    COUNT(*) AS total_requests
  FROM
  `[PROJECT].[DATASET].[TABLE_NAME]`
  WHERE
    body.status IS NOT NULL
  GROUP BY
    date
)

SELECT
  date,
  server_error_count,
  user_error_count,
  total_requests,
  ROUND((server_error_count + user_error_count) / total_requests * 100, 2) AS error_percentage
FROM
  ErrorCount
ORDER BY
	  date;
Example 4: Analyse dataset usage
/* Replace [PROJECT], [DATASET], and [TABLE_NAME] with your details */

SELECT
  attributes.sanity.dataset AS dataset_name,
  COUNT(DISTINCT attributes.sanity.groqQueryIdentifier) AS unique_get_queries,
  COUNT(*) AS total_requests,
  SUM(body.responseSize) AS total_response_size
FROM
  `[PROJECT].[DATASET].[TABLE_NAME]`
WHERE
  attributes.sanity.dataset IS NOT NULL
GROUP BY
  dataset_name
ORDER BY
  total_requests DESC;
Technical details for log delivery
Delivery
- Process: Logs are delivered to the customer's GCP Cloud Storage bucket in batches contained in compressed NDJSON files.
- Data Window: Each file will contain 10K lines of data or 5 minutes worth of data.
Guarantees
- Delivery Assurance: Logs are guaranteed to be delivered at least once. This means that the customer must perform deduplication processes if exact data is required.
- Consumer Responsibility: Customers are responsible for deduplication of logs if necessary.
Retries
- Retry Mechanism: In case of inaccessible customer storage, Sanity will attempt multiple retries with exponential back-off.
- Retry Limit: There's a cut-off time after which retries stop. Currently, five attempts will be made in approximately 70 seconds before the service will cease further attempts.
- Consequences of Failure: Persistent failure in file transfers will lead to disabling of the integration, requiring customers to reconfigure it.
Security
Customers have full control of the data and the security of their systems; the solution has multiple levels of security;
- Customers must allow Sanity access to their GCP environment by giving write access to a Sanity-owned Google service account.
- Sanity will deliver files from a static IP listed in this file. Customers with greater security needs, for example, buckets behind a VPN, should be given a link to this file.
- Customers can whitelist Sanity in their Google environment by adding our
DIRECTORY_CUSTOMER_IDas an allowedgcloudorganization. Sanity’s customer ID can be found in the project management area during the setup process.
Was this page helpful?